Kyle Nickel
Conservation Science and Community
BIO 631 D
CEL 1- Community Profile
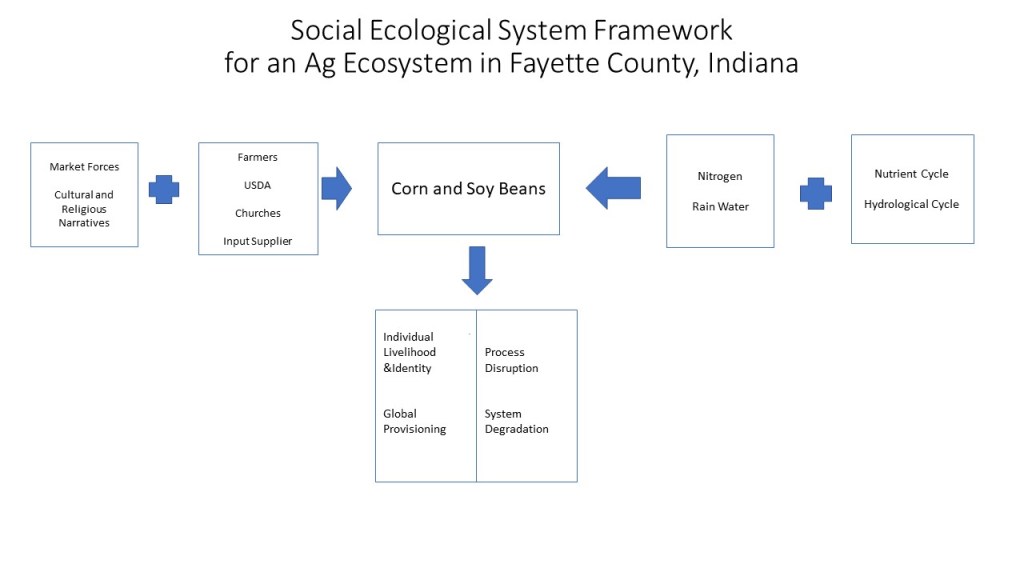
This social ecological system framework for Fayette County, Indiana is based on limited components of it’s dominant ecosystem, row crop production. Market forces and cultural and religious narratives direct the choices of farmers, government agencies, churches, and input suppliers in their land use decisions. These choices may manipulate the natural processes of the nutrient and hydrological cycles. These human and natural elements combine to create an ecosystem that provides global provisioning and individual livelihoods and identities, but this ecological service comes at the costs of process disruption and degradation.
SES Framework- Fayette County, Indiana: Agricultural Ecosystem
Indiana began drifting north approximately 400 million years ago, a few centimeters at a time. Even if I hadn’t learned of the state’s equatorial origins in 3rd grade Indiana History class, the evidence of a shallow sea filled with coral reefs- brachiopods, crinoids, horn coral- can be found in many places where creeks and rivers expose bedrock. Ecological processes continued without the presence of humans in the northern two thirds of the state until 13,000 years ago. It was then that the last of the Wisconsin glaciers retreated (Indiana University), making way for humans.
Fayette County, Indiana lies on the dividing line between the glaciated and unglaciated landscapes (see Fig.1). It is not an obvious, clearly identifiable line. Driving the length of Indiana State Road 1, a person might notice that topography does not become truly flat until one is north of Fayette County, nor truly hilly until south of it. The division results in the county being in both the Eastern Corn Belt Plains and the Interior Plateau (EPA). The division is also responsible for a variation in land use.
Unlike counties to the north that are dominated by corn and soybeans or counties to the south that are predominantly wooded, Fayette County is 51% percent corn and soybeans. Connersville, the county seat, makes up a vast majority of the 7% of developed land. Wheat, alfalfa, and specialty crops make up approximately 3%. Only 157.4 acres of wetland remain in all 215 square miles. The remainder is made up of forest and pasture (see fig.2) (USDA NASS).
It is only by a slight margin that row crop agriculture makes up the majority of the land in Fayette County. However, it is likely where there is the greatest interaction of ecological services and ecological processes. It is also the ecosystem I have the best understanding of after more than 20 years in ag industry in varying capacities. Therefore, the agroecosystem will be the focus of the social-ecological systems framework I explore in my community profile.
The predominant ecological service of an agroecosystem is provision. There was, at one point, some hope that row crop agriculture could contribute to carbon sequestration. In the mid 2000s I worked for a national nonprofit conservation ag group that widely promoted the idea that a transition to continuous no-till could combat global warming. Monsanto and John Deere were major financial contributors who stood to gain from this transition in practice. However, improved methodologies and better understanding of how farmers implemented this practice have largely discredited the idea (Vandenbygaart, 2016). There is an element of cultural service I will address later, but growing food for humans is the primary function.
The impact of agriculture on ecological processes is vast. The first documented European settler, John Conner, arrived in what would become Fayette County 1802 to establish a trading relationship with the native people, but 1812 the last indigenous people had been forced out. In their place, settlers established the foundations for the ag economy we know today at the manipulation of nearly every, if not all, ecological processes. I will only address the hydrological cycle and the nutrient cycle.
Irrigation for agriculture gets a lot of press. It currently accounts for 70% of all freshwater use globally, and will likely need to increase in the near future, just as it’s availability decreases (World Bank). In Fayette County there are less than a handful of irrigation systems and they are only operated in the driest years. Rather than not enough water, we have too much. This is remedied with the systematic installation of field tile.
A field tile system is a grid of water permeable pipes placed in the ground below a crops root system, usually about 5 or 6 feet deep. This allows the soil to hold moisture where the plant needs it, but prevents the soil from becoming saturated. The system has an outlet at slightly lower elevation and drains into a waterway or ditch. Historically, this is the means by which wetlands were drained. Currently, this prevents groundwater recharge (Powers, 2010) and causes sediment and nutrient build up in downstream waterways (Schotter, et al, 2014).
Increased yields and the resulting economic gains are the driving human component. There are no government programs that I know of that incentivize the installation of tile. However, a producer can lose his crop insurance subsidy for installing tile in a wetland.
No current county level data was available for tile usage. However, statewide tiled acres increased 4.2% between 2012 and 2017 to 49% of tillable acres (Zulauf, et al, 2019). The frequency with which I see systems being installed would lead me to believe that rate of growth has continued and is now over 50%. Through various professional responsibilities I have been on a significant number of farms in Fayette County and believe that 50% would be a good ballpark estimate, putting tiled acres at around 36,000 to 37,000 acres.
The nutrient cycles, particularly nitrogen, in Fayette County are dependent largely on transportation infrastructure. It comes in off the highway in semi tankers and leaves in rail cars. The idea of growing legumes and grasses together or in rotation is, as far as I know, as old as agriculture itself. I saw it this summer in Belize where a milpa was planted just as it had been for as long anyone could remember. The difference here is that we have bred our corn to need more nitrogen than our beans can provide.
In 1959 the average corn yield in Indiana was 68 bushels per acre. Nitrogen was not recommended for corn at that time, unless for some reason a producer was forced to break his rotation and plant corn after corn. Even then, only 40-60 pounds per acre were recommended. There was a steady increase in yield and nitrogen use based on a corn varieties potential yield until 1995. Though farmers had likely been doing cost benefit analysis of their own the whole time, it was not until 2006 that soil type and nitrogen costs were factored into recommendations. That year the east central region of Indiana where Fayette County is located averaged 150 bushels per acre using 148 pounds of nitrogen per acre (Camberto, 2011).
Fayette County average 191 bushels of corn per acre in 2020. This 41 bushel increase from 2006 was done with 157 pounds/acre of N, only a 9 pound increase(USDA NASS). I attribute this increase in efficiency to the wide adoption of precision application and the move 28 as the dominant N source. Rather than apply 150 pounds to every acre, precision application addresses the N need of 2 or 3 acre grids. Applying 28- a water based solution that is 28% urea and ammonia nitrate- after the plant emerges is more efficient than applying dry urea in the fall. It’s immediately plant available, doesn’t have to go through the ammonization portion of the N cycle, and doesn’t end up in tile and eventually the ditch if there’s a hard rain.
It is worth noting that the base level of nitrogen likely hasn’t changed much since 1959, but it all has to come from somewhere far away and all that corn goes has to go somewhere far away. The factory where it is made and the feed lot or Pepsi plant where it is used have their own SES issues to consider. And that is to say nothing of the enormous amount of energy it takes to move it all around.
Like field tile, nitrogen application is a market based decision. The interaction of ecosystem processes and services becomes more complicated when viewed with a cultural perspective. This is particularly true regarding religion and the narratives embedded in it (Systems Innovation, 2016).
I have been in the crop insurance business for a dozen years. I don’t know exactly how many different kitchen tables I’ve sat at in that time, going over settlement sheets, bin measurements, and marketing plans, but it’s close to 100 if I include the surrounding counties. In many of those kitchens, maybe even a majority of them, there is a painted sign or poster or refrigerator magnet of the Paul Harvey FFA speech “So God Made a Farmer” made known to the rest of the non-ag world by the 2013 Dodge Super Bowl Ad (Dodge). The idea that man was created as the caretaker of creation is a major tenet of Christian belief.
Farmers’ relationship with nature may be viewed as predominantly utilitarian and dominionistic (Kellert, 96), but their love of the land is deep and sincere. That relationship is the source of their livelihood, heritage, and a good portion of their identity. The result is a modern and personal Manifest Destiny- the impulse for expansion no longer points west, but towards unused fence rows, abandoned barn lots, overgrown locust thickets, or any piece of ground a landowner may feel is slipping back into mother nature’s hands. Reclaiming it isn’t just good stewardship, but doing God’s will.
Closely related to the religious narrative is the moral one-farmers do the work of feeding God’s people. There are less and less farmers feeding more and more people. Farmers are famously “dirt rich and cash poor.” Ive seen enough tax returns and loan restructurings to know it’s possible to have a million dollars worth of land and have a negative net worth. The pride of doing the important work of feeding people takes some of the sting out of being broke.
The truth of that moral narrative may not be as generous as some producers would hope.I also know from those tax documents and loan restructurings that profitability has little to do with commodity markets and yields, but everything to do with input costs- chemical, fertilizer, machinery, fuel. In 1995 Fayette County corn averaged 116 bu/acre while 4.14% of U.S. residents fell into the lowest food insecurity category. This is the category of people who not only did not have food, but did not have the resources or coping skills to acquire it. Last year Fayette County averaged 191 bu/acre and the lowest level of food insecurity was relatively unchanged at 3.94%. (USDA NASS, USDA ERS). It can be inferred that a sizable portion of the value of that difference went to large corporations that provide the inputs.
This brief look at nitrogen, rain water, and narratives does not even begin to address the complexity of a SES framework for the row crop land in Fayette County, let alone the remaining 49% of the land. The heated debate over a proposed windmill farm, the public outcry over loss of access to the Whitewater River, aggressive logging of private forests, the successful installation of small public walking trail, or the move away from small scale animal agriculture are just a few places where the relationship between humans and biological components and their processes could be considered to create a more elaborate framework.

Figure 1. https://igws.indiana.edu/Surficial
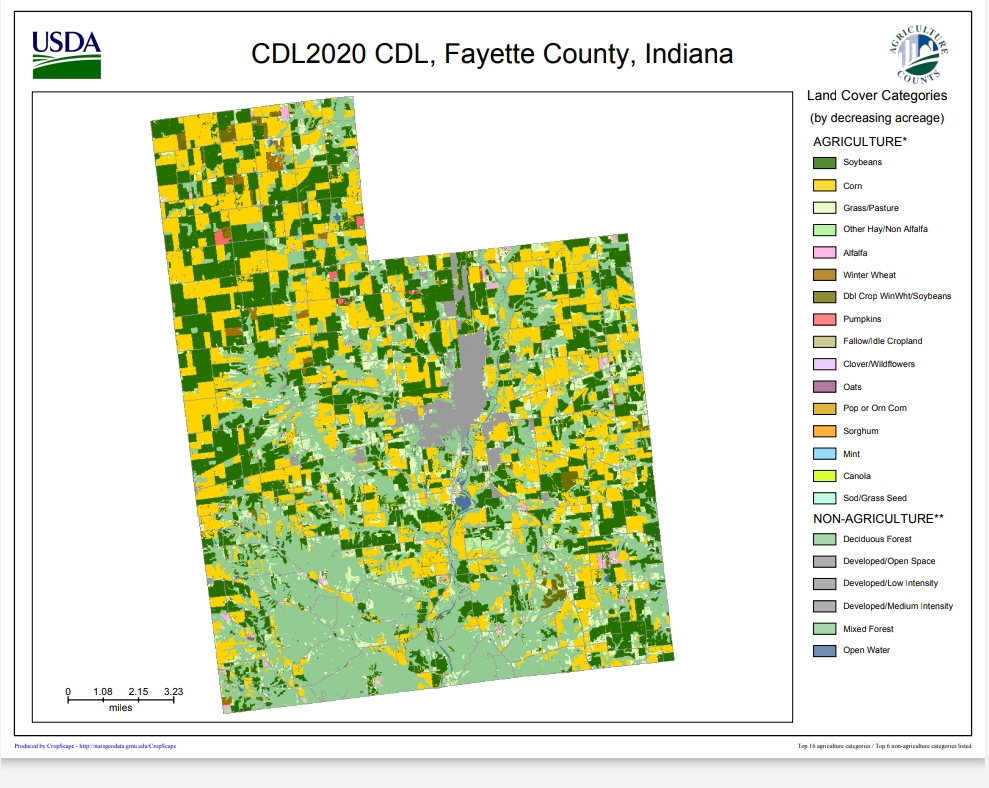
Figure 2. https://nassgeodata.gmu.edu/CropScape/
References
Camberto, J. (2011) A Historical Perspective on Nitrogen Fertilizer Rate Recommendations for Corn in Indiana. Purdue University. Extension Publication AY-335-W.
Dodge. (2013) “Farmer.” https://www.youtube.com/watch?v=AMpZ0TGjbWE
EPA. Ecoregions of the United States. https://www.epa.gov/eco-research/ecoregions
Indiana University. Surficial Geology. https://igws.indiana.edu/Surficial
Kellert, S. R. (1996). The value of life: Biological diversity and human society. Washington, D.C: Island Press [for] Shearwater Books.
Power, Alison G. (2010) Ecosystem services and agriculture: tradeoffs and synergies. Phil. Trans. R. Soc. B. 365: 2959–2971.
Schottler, S.P., Ulrich, J., Belmont, P., Moore, R., Lauer, J.W., Engstrom, D.R. and Almendinger, J.E. (2014), Twentieth century agricultural drainage creates more erosive rivers. Hydrol. Process., 28: 1951-1961.
Systems Innovation (2016, February 20). Social Ecological Systems [Video File]. Retrieved from https://www.youtube.com/watch?v=2r_Fms8uWZk
USDA, ERS. Food Security Status of U.S. Households in 2020 https://www.ers.usda.gov/topics/food-nutrition-assistance/food-security-in-the-us/key-statistics-graphics.aspx
USDA, NASS. Cropscape. https://nassgeodata.gmu.edu/CropScape
VandenBygaart, A. (2016). The myth that no-till can mitigate global climate change. Agriculture, Ecosystems & Environment, Volume 216, 2016, Pg 98-99.
World Bank. (2020). Water in Agriculture. https://www.worldbank.org/en/topic/water-in-agriculture
Zulauf, C. and B. Brown. (2019). “Use of Tile, 2017 US Census of Agriculture.” farmdoc daily (9):141, Department of Agricultural and Consumer Economics, University of Illinois at Urbana-Champaign https://farmdocdaily.illinois.edu/2019/08/use-of-tile-2017-us-census-of-agriculture.html
